1. Overview
The simulator performs targeted traversals on a large, precomputed AI model network stored in Graphviz
.dot format. Two traversal modes are supported: Forward/Downstream Traversal for downstream
derivations and Backward/Upstream Traversal for upstream provenance.
2. Quick Start
- Click Visualization to open the interactive app.
- Ensure the Graph File Path points to your served
.dotfile. - Choose a direction: Forward/Downstream or Backward/Upstream.
- Type 2–3 characters in the model search box, select a model, then click Run Traversal.
- Explore the visualization and copy/download the generated DOT subgraph.
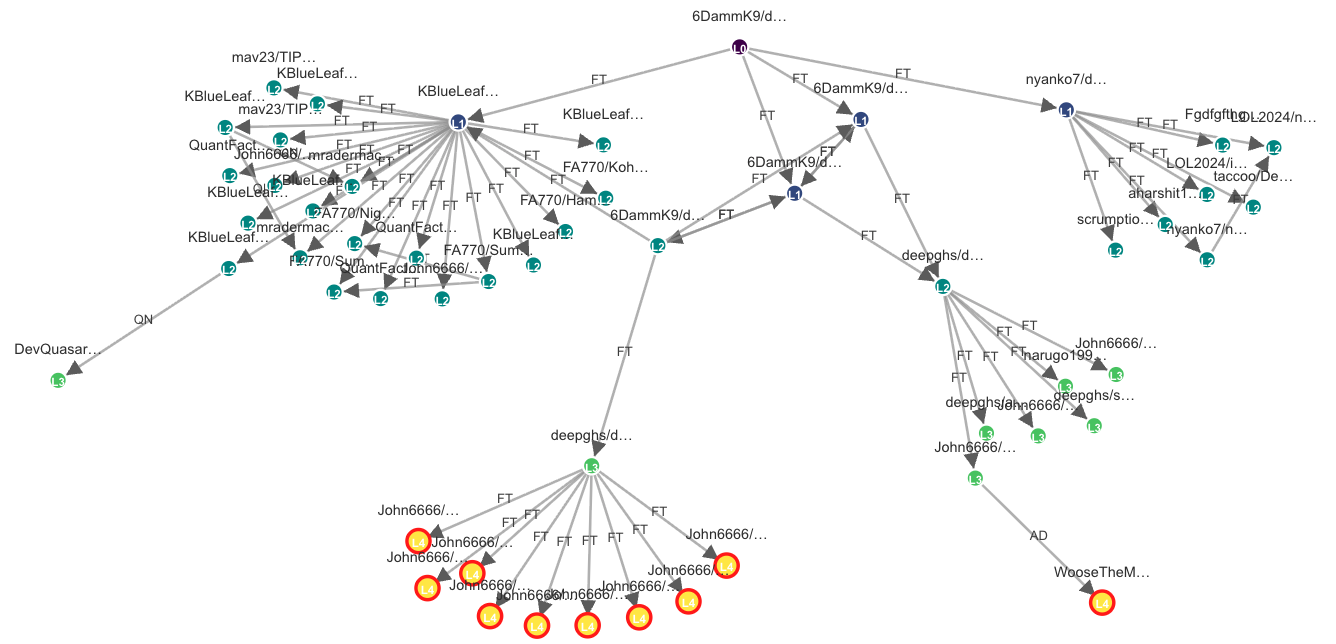
3. Legend & Semantics
- FT — Fine-tuned
- AD — Adapter (LoRA/QLoRA)
- QN — Quantization (incl. GGUF)
- MR — Merged models
- Node color encodes depth (level).
- Red outline marks extremes: terminal nodes in forward mode, base models in backward mode.
- Edge labels show the abbreviations above.
4. Data Requirements
Input must be a valid Graphviz digraph. Edges can provide label= attributes
(e.g., label="finetune") to classify as FT/AD/QN/MR.
5. Exported DOT
The app generates a compact DOT file with ranks, edge labels, and notes on node counts, depth, and key paths to terminal or base nodes.
6. Performance Tips
- Large subgraphs automatically use Sigma/Graphology for fast rendering.
- Use Desired Graph Level to cap traversal depth for responsiveness.
- Edge labels are drawn for small graphs in SVG and for big graphs via Sigma edge labels.
7. Troubleshooting
If the model isn’t found, verify its exact name in the typeahead list or confirm the DOT file contains the node.
For CORS or file load errors, ensure the DOT file is served from the same origin as the app.